前记 所有提供服务的框架都需要跑性能测试, 经过性能测试来发现了解服务的qps有多少, 是否有人为的因素导致性能不足以及是否有需要优化的代码。
一般来说,服务框架的性能测试都需要跟同类的框架一起做比较, 我在编写rap 之前, 用的是aiorpc , 所以在设计rap 时参考了aiorpc , 最后进行性能测试的时候也是跟aiorpc 进行比较。
由于我引入了单连接复用的功能, 所以在预想中我编写的框架性能应该是比aiorpc 性能好, 可是最后的测试结果却是不如意的, 所以就开始了优化之旅。
1.性能对比 在aiorpc 简介中列出作者对几个相关框架压测的qps数据对比, 如下:
aiorpc
Official MesssagePack RPC
ZeroRPC
2236
3112
352
可以看到aiorpc比Official MesssagePack RPC性能差一些, 但两者相近, 所以我就以aiorpc 为模板, 同时复制了他的代码, 在本地一起压测, 压测结果如下:
1
2
3
4
5
6
7
8
9
10
通过结果可以发现[rap]的性能也太拉跨了, 同样的实现, 同样的原理, 性能却是[aiorpc]的10分之一, 即使用了单连接复用后, 性能也只有[aiorpc]的3分之一, 急需优化, 同时也可以看出有大量的优化空间。
2.优化性能工具 性能优化首先要找到瓶颈在什么地方,才能做针对性的优化, 但是函数的调用链非常的长, 我们需要借助一些工具来帮忙剖析调用情况, 在Python生态中, 现有且还有更新的性能剖析方法有官方自带的cProfile 和pyinstrument , 他们都是非侵入式的, 在官方实现的模块能满足我的需求的时候, 我都会优先使用官方的模块, 同时他的数据是最准确的, 所以本次选用的性能剖析工具是cProfile。
NOTE: 性能剖析工具分为Deterministic profiler和Sampling profiler两大类, cProfile是基于Deterministic Profiling实现的,这类型是通过sys.settrance 在各个调用的函数打点,并在运行时记录所有函数每次的执行状况, 所以开销会比较大, 数据也比较准确。pyinstrument是通过Sampling profiler实现的, 这类型是调用POSIX Interval timer每隔一段时间中端进程获取整个堆栈信息,以此来估计每个函数的执行时间和开销,性能开销比较小, 但记录可能不会准确。
2.1.cProfile cProfile是Python标准库中内置的性能分析模块,基于C的扩展,非侵入式,不需要修改代码。它的使用方法是:
1 python -m cProfile [-s sort_order] main.py
其中-s指定输出的排序方法, 有ncalls, tottime, cumtime几个字段可选,于是我就按照使用方法运行程序, 输出如下:
1
2
3
4
5
6
7
8
9
10
11
12
13
14
15
16
17
18
19
20
21
22
23
24
25
26
27
➜ rap git:(master) ✗ py run python -m cProfile -s cumtime example/benchmark/benchmark_rap_by_single_conn_multiplexing.py2853 qps2583236 function calls (2569633 primitive calls) in 4.668 seconds319 /1 0.004 0.000 4.682 4.682 {built-in method builtins.exec }1 0.000 0.000 4.682 4.682 benchmark_rap_by_single_conn_multiplexing.py:1 (<module>)1 0.000 0.000 3.517 3.517 benchmark_rap_by_single_conn_multiplexing.py:26 (run_client)3 1.584 0.528 3.516 1.172 {method 'run_until_complete' of 'uvloop.loop.Loop' objects}29900 0.019 0.000 1.537 0.000 tasks.py:596 (_wrap_awaitable)29900 0.039 0.000 1.501 0.000 core.py:124 (wrapper)29900 0.048 0.000 1.150 0.000 core.py:178 (raw_invoke)1 1.001 1.001 1.001 1.001 {built-in method time.sleep}20000 0.041 0.000 0.953 0.000 transport.py:286 (request)20008 0.091 0.000 0.864 0.000 transport.py:237 (_base_request)20008 0.026 0.000 0.361 0.000 asyncio_helper.py:61 (as_first_completed)28 0.000 0.000 0.345 0.012 __init__.py:1 (<module>)20010 0.113 0.000 0.331 0.000 tasks.py:335 (wait)10005 0.047 0.000 0.305 0.000 transport.py:267 (write_to_conn)10000 0.032 0.000 0.281 0.000 utils.py:121 (param_handle)277 0.010 0.000 0.222 0.001 base.py:114 (_listen_conn)10282 0.031 0.000 0.198 0.000 transport.py:93 (dispatch_resp_from_conn)
这段输出会显示很多数据, 每个字段都有不同的含义:
ncalls:每个函数被调用次数
tottime:表示该函数本身的执行时间,不包括该函数调用的子函数
cumtime:表示该函数累计执行时间,包括该函数调用的子函数
percall: 第一个percall表示 tottime/ncalls, 第二个percall表示cumtime/primitive calls,primitive calls表示除去递归后本函数被调用次数。
虽然输出很详细, 但是这样看数据排查问题也太废眼睛了, 我看没几分钟就开始受不了, 也觉得麻烦。
2.2.火焰图 cProfile输出了很多内容, 但是很难从终端输出直观的看出主要是开销是哪些函数, 这时就需要一些Gui工具来帮忙快速发现问题函数了。
工具flameprof 可以通过解析cProfile生成的prof文件来生成火焰图, 火焰图能直观的反应函数的调用关系与调用时长, 使用命令如下:
1
2
python -m cProfile -o demo.prof main.py
于是我调用命令生成火焰图:
1
2
python -m cProfile -o aaa.prof example/benchmark/benchmark_rap_by_single_conn_multiplexing.py
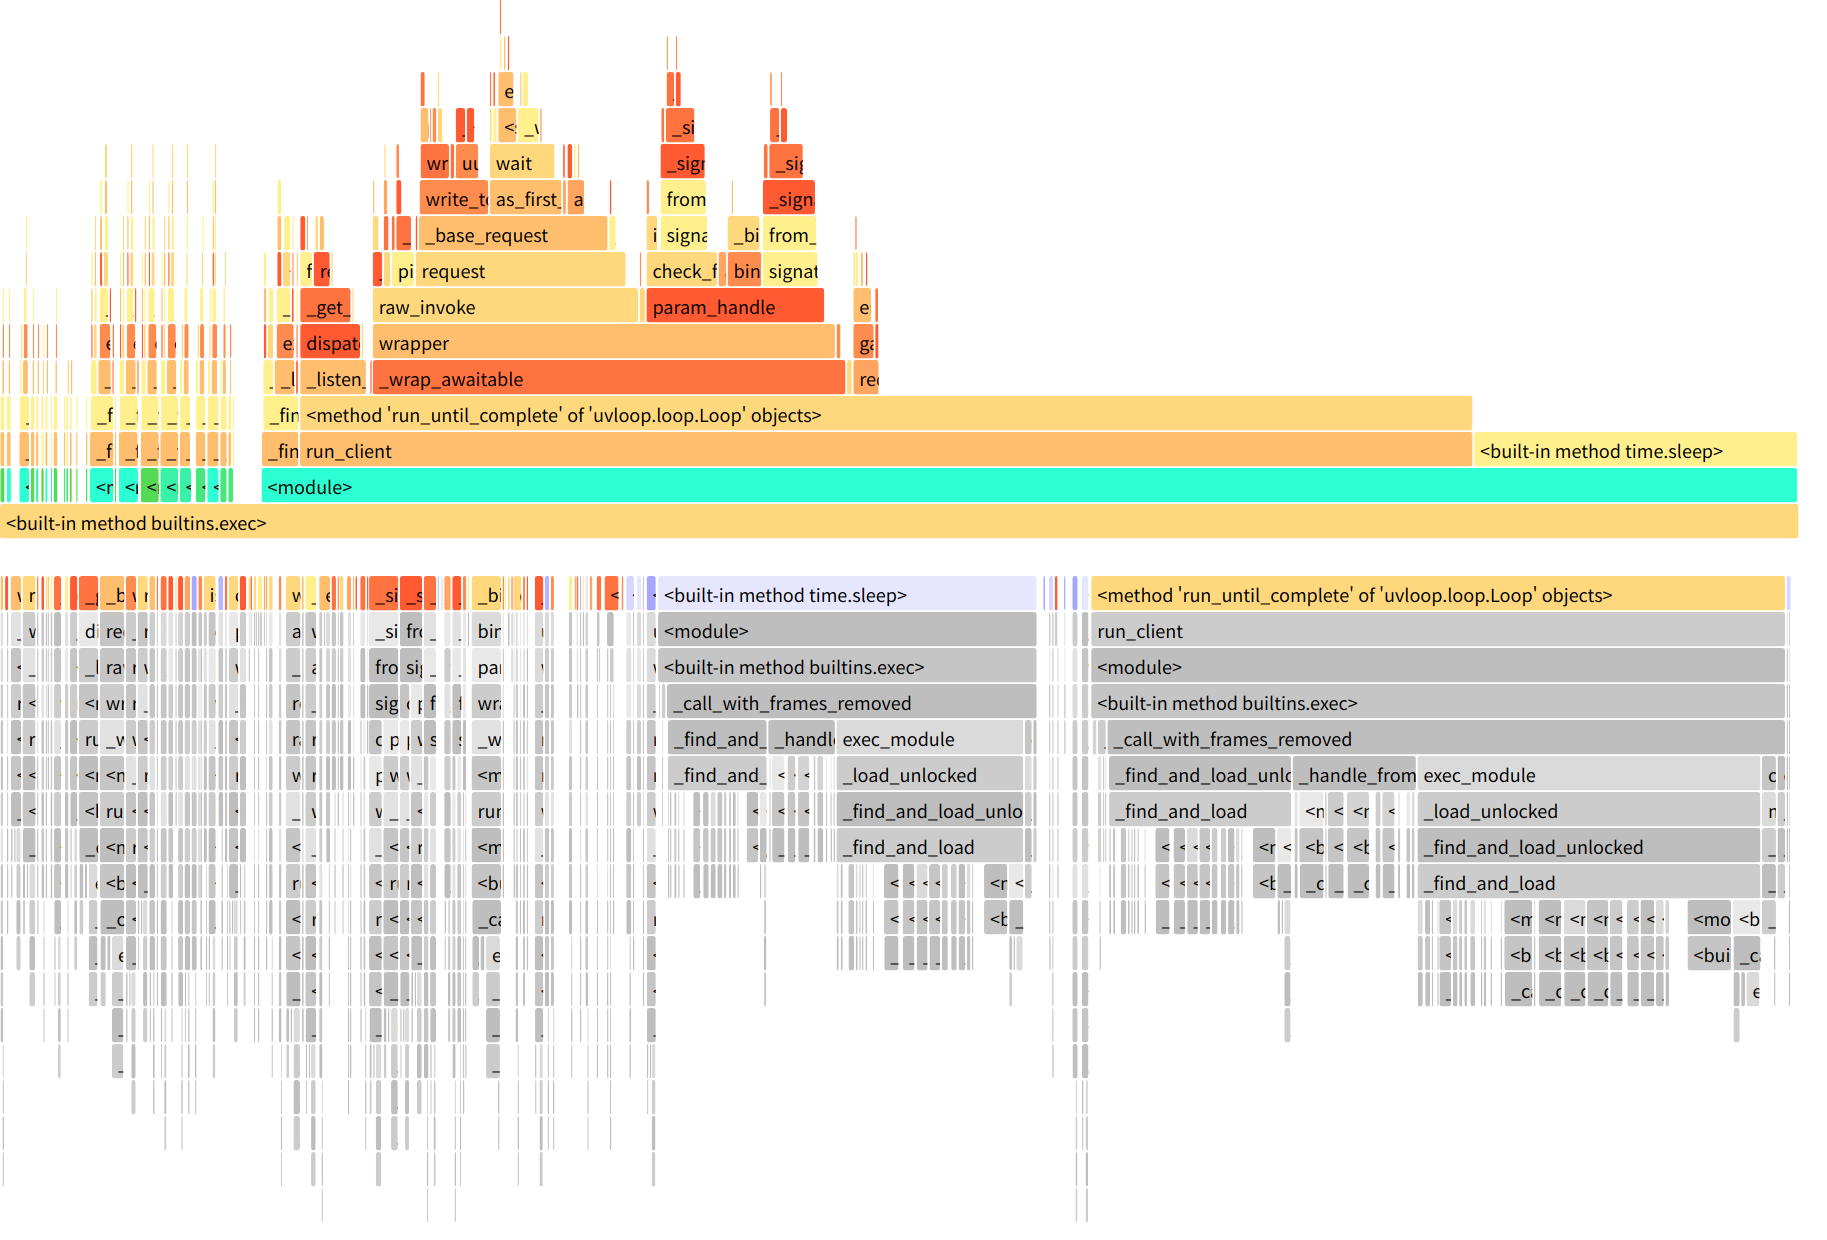
run_client是最顶层的函数,往上是它调用的子函数,直到调用链最底层的函数。宽度表示每个函数的执行时间占用的比例,越宽表示越耗时。 可以看出来火焰图比cProfile直观一些, 可视化有助于我们快速发现问题函数, 但是这种火焰图只局限于展示, 没有提供更多的操作, 当调用层级较高时(也就是火焰图最上面的调用数据展示), 上面的函数就很难一下子看懂了, 在经过一番搜索后发现了snakeviz , 它基于prof文件生成一个火焰图页面, 使用者可以在火焰图页面做一些交互操作, 更容易发现问题函数。
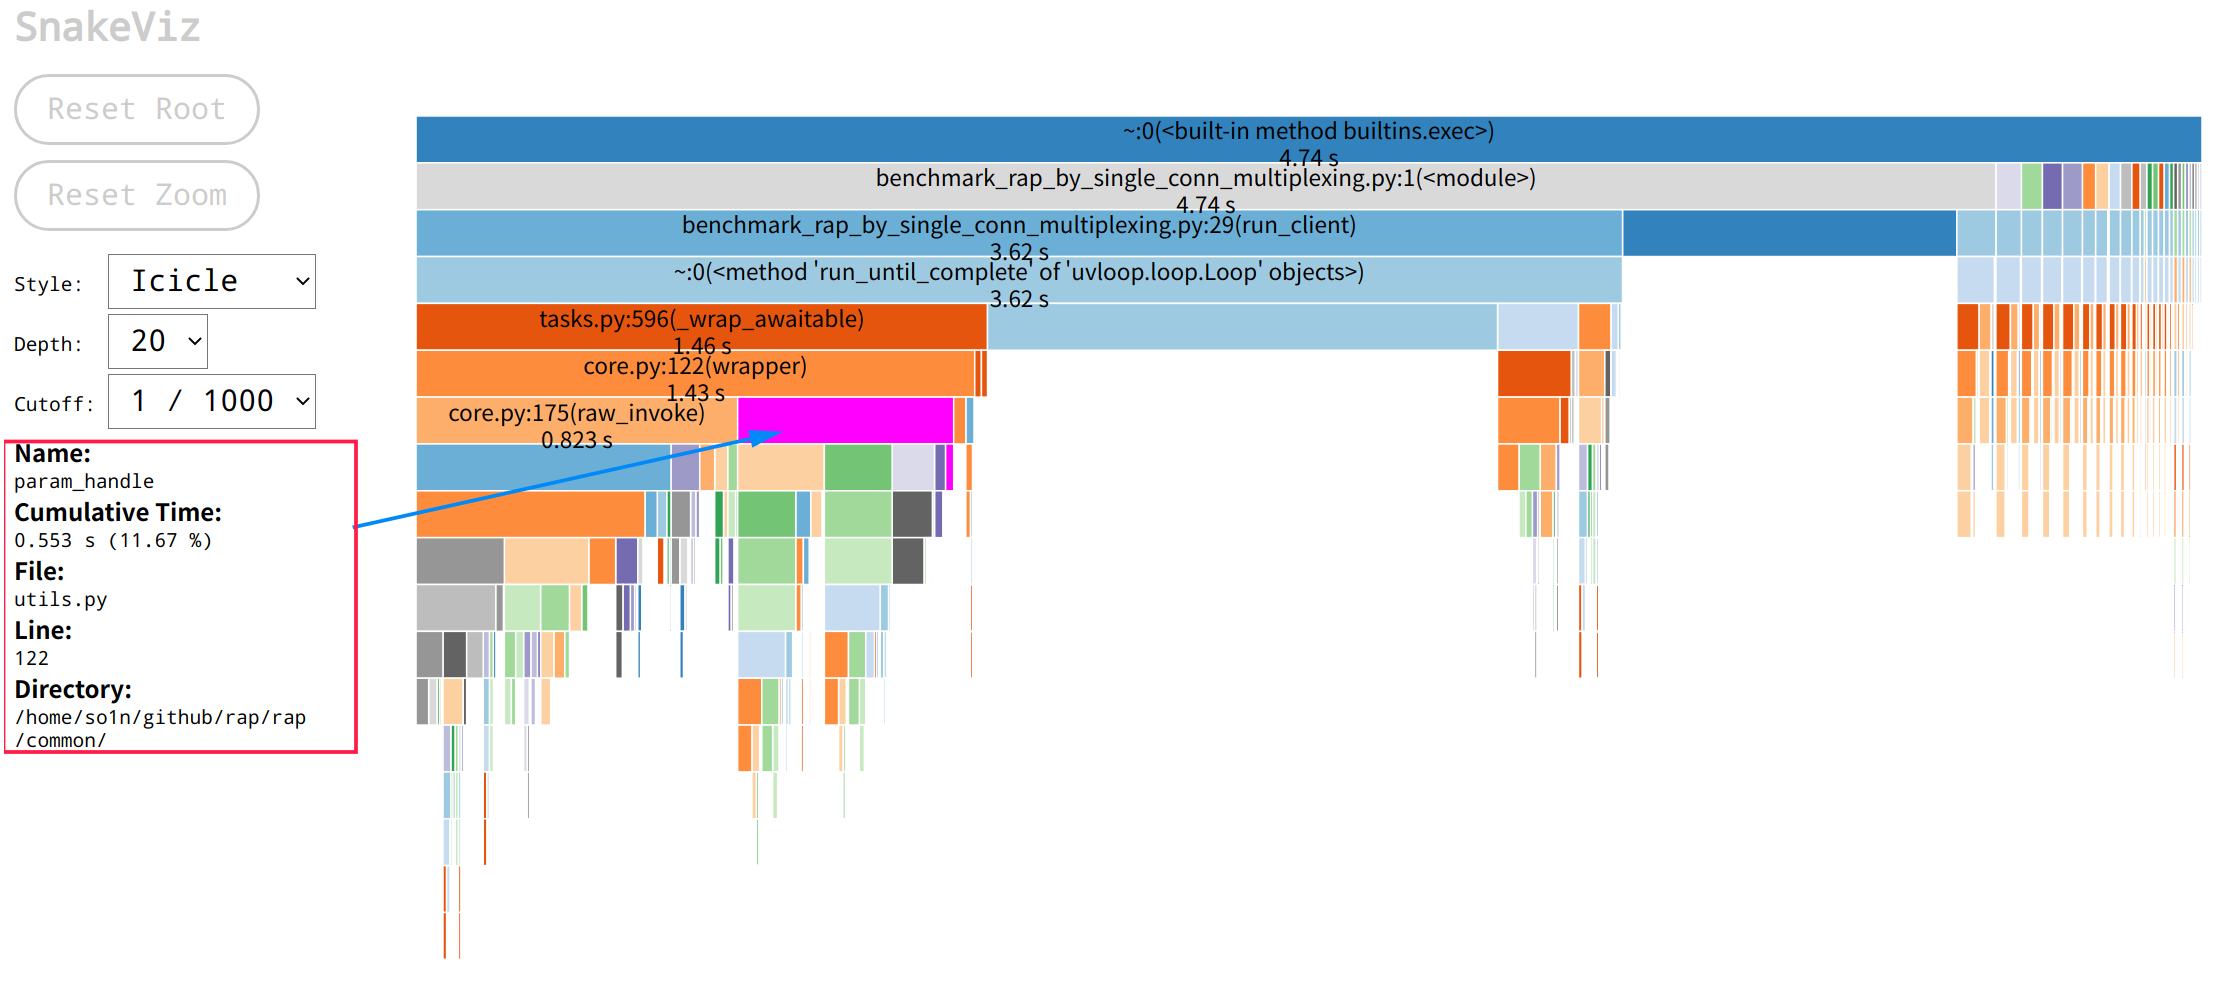
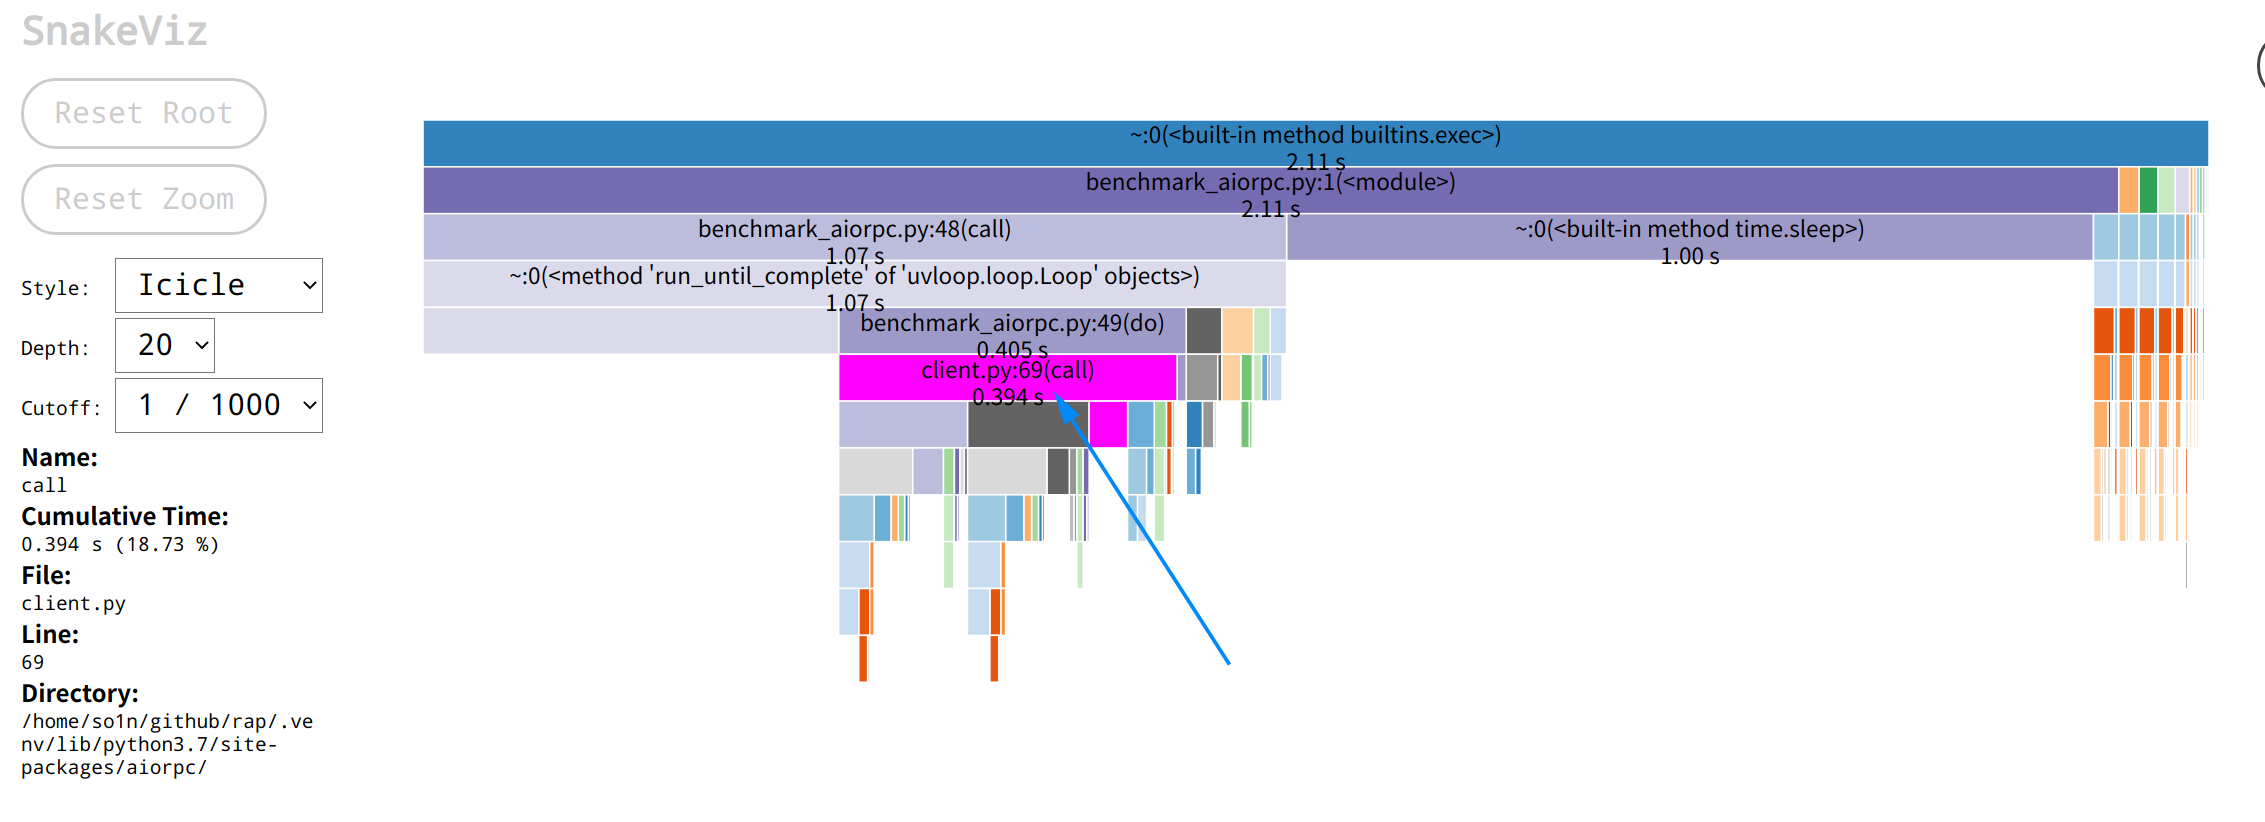
3.分析问题 工具搞定了, 就可以开始分析问题了, 首先看aiorpc 的运行火焰图:aiorpc火焰图 call只用了0.394秒, 而我的框架的主要调用火焰图如下:rap火焰图 core.py:122(wrapper)方法用了1.43s,是aiorpc 的三倍, 其中参数调用方法param_handle耗时为0.53,请求方法raw_invoke耗时0.82, 这时候想要往下看param_handle会发现展示区域太小了, 可以点击param_handle块,然后就会跳转到以param_handle为顶层的页面,展示的数据更多了:rap param_handle火焰图
通过火焰图可以发现,param_handle的火焰图中包含大量的inspect模块的相关使用以及check_func_type函数, 所以他们的运行性能会影响到param_handle的运行性能, 其中inspect.signature最耗时间, 这时需要从源码进行分析, 它们的代码如下:
1
2
3
4
5
6
7
8
9
10
11
12
13
14
15
16
17
18
def check_func_type (func: Callable, param_list: Sequence[Any], default_param_dict: Dict[str , Any] ) -> None :"""Check whether the input parameter type is consistent with the function parameter type""" for index, parameter_tuple in enumerate (func_sig.parameters.items()):if parameter.default is parameter.empty:if not is_type(type (param_list[index]), parameter.annotation):raise TypeError(f"{param_list[index]} type must: {parameter.annotation} " )else :if not is_type(type (default_param_dict.get(name, parameter.default)), parameter.annotation):raise TypeError(f"{default_param_dict[name]} type must: {parameter.annotation} " )def param_handle (func: Callable, param_list: Sequence[Any], default_param_dict: Dict[str , Any] ) -> Tuple[Any, ...]:"""Check whether the parameter is legal and whether the parameter type is correct""" return new_param_list
通过代码可以发现inspect.signature的所在位置, 它的功能是用于生成函数签名, 但是函数签名这个东西是不会变动的, 同时调用端基本上都使用了Python的装饰器, 在启动的时候就可以生成函数签名了, 所以这个函数可以逻辑可以改为只接收inspect.Signature对象, 减少重复生成开销, 修改后如下:
1
2
3
4
5
6
7
8
9
10
11
12
13
14
15
16
17
18
def check_func_type (func_sig: inspect.Signature, param_list: Sequence[Any], default_param_dict: Dict[str , Any] ) -> None :"""Check whether the input parameter type is consistent with the function parameter type""" for index, parameter_tuple in enumerate (func_sig.parameters.items()):if parameter.default is parameter.empty:if not is_type(type (param_list[index]), parameter.annotation):raise TypeError(f"{param_list[index]} type must: {parameter.annotation} " )else :if not is_type(type (default_param_dict.get(name, parameter.default)), parameter.annotation):raise TypeError(f"{default_param_dict[name]} type must: {parameter.annotation} " )def param_handle (func_sig: inspect.Signature, param_list: Sequence[Any], default_param_dict: Dict[str , Any] ) -> Tuple[Any, ...]:"""Check whether the parameter is legal and whether the parameter type is correct""" return new_param_list
其次就是check_func_type这个函数了, 里面都是我自己通过debug慢慢调试出来写的校验参数的代码, 没多少优化空间了, 只能转战下一个地方, 现在点击右上角的Call Stack选择回到一开始的界面, 重新选择请求流程的另外一块raw_invoke:
通过火焰图可以看到,请求流程raw_invoke的总耗时0.857秒, 其中主要占用为request的0.675耗时, 其他没显示出来的具体是选择连接pick(0.07s), 信号量封装(共计0.05s), 这两个基本上没有多少优化的空间了, 除非是不需要健全的服务调用功能。
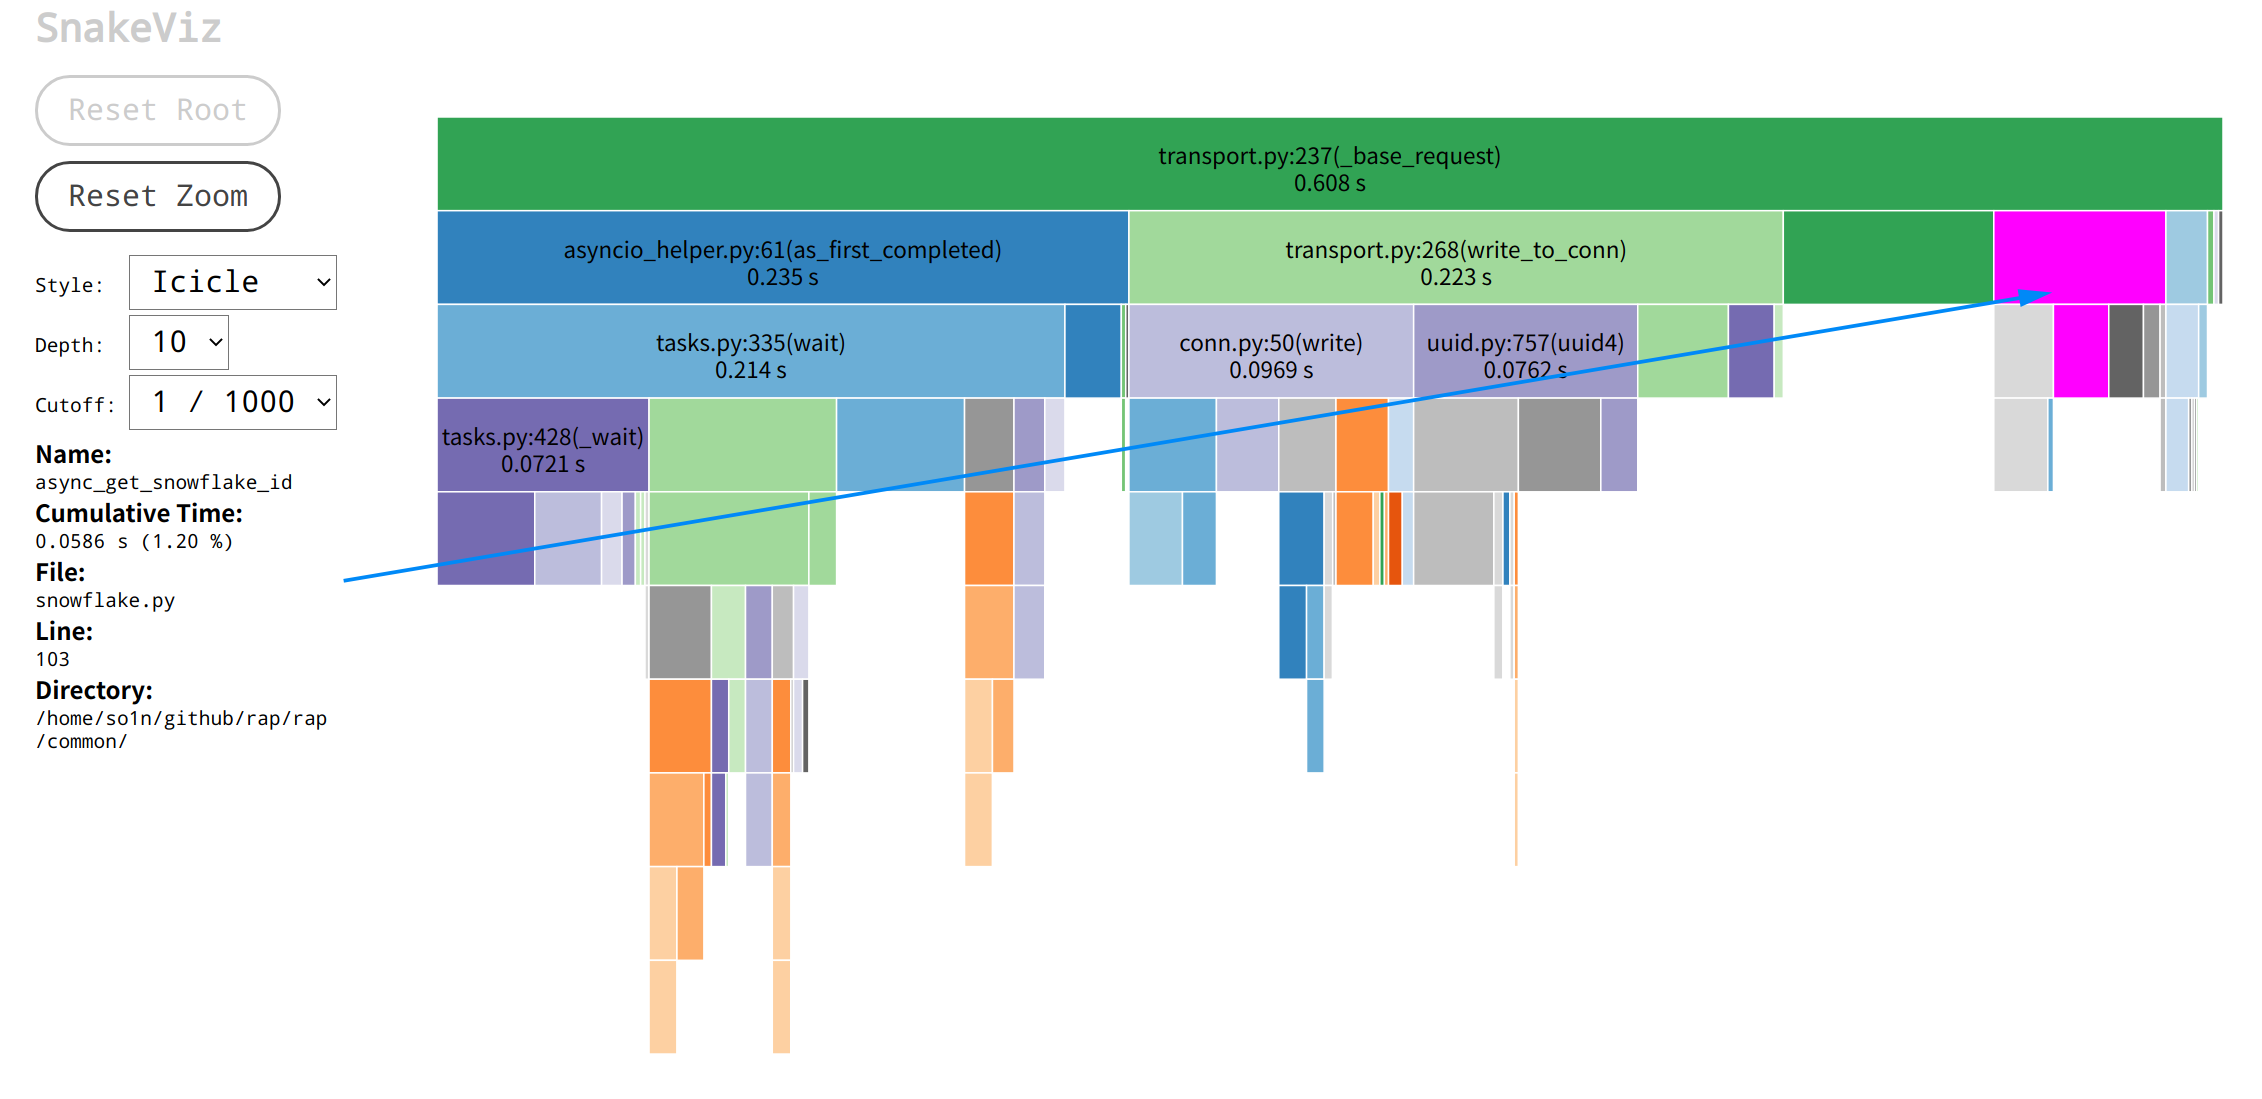
所以我的排查重点来到了transport.py的_base_request调用, 其中蓝色箭头所指的是获取雪花id的函数调用async_get_snowflake_id:as_first_completed, write_to_conn和async_get_snowflake_id, _base_request函数, 它们的源代码如下, 可以看到三个函数所处的位置:
1
2
3
4
5
6
7
8
9
10
11
12
13
14
15
16
17
18
19
20
21
22
23
24
25
26
27
28
29
async def _base_request (self, request: Request, conn: Connection ) -> Response:"""Send data to the server and get the response from the server. :param request: client request obj :param conn: client conn :return: return server response """ str (await async_get_snowflake_id())str = f"{conn.sock_tuple} :{request.correlation_id} " try :if self.app.through_deadline and deadline:"X-rap-deadline" ] = deadline.end_timestampawait self.write_to_conn(request, conn)await as_first_completed(return responsefinally :None )if pop_future:
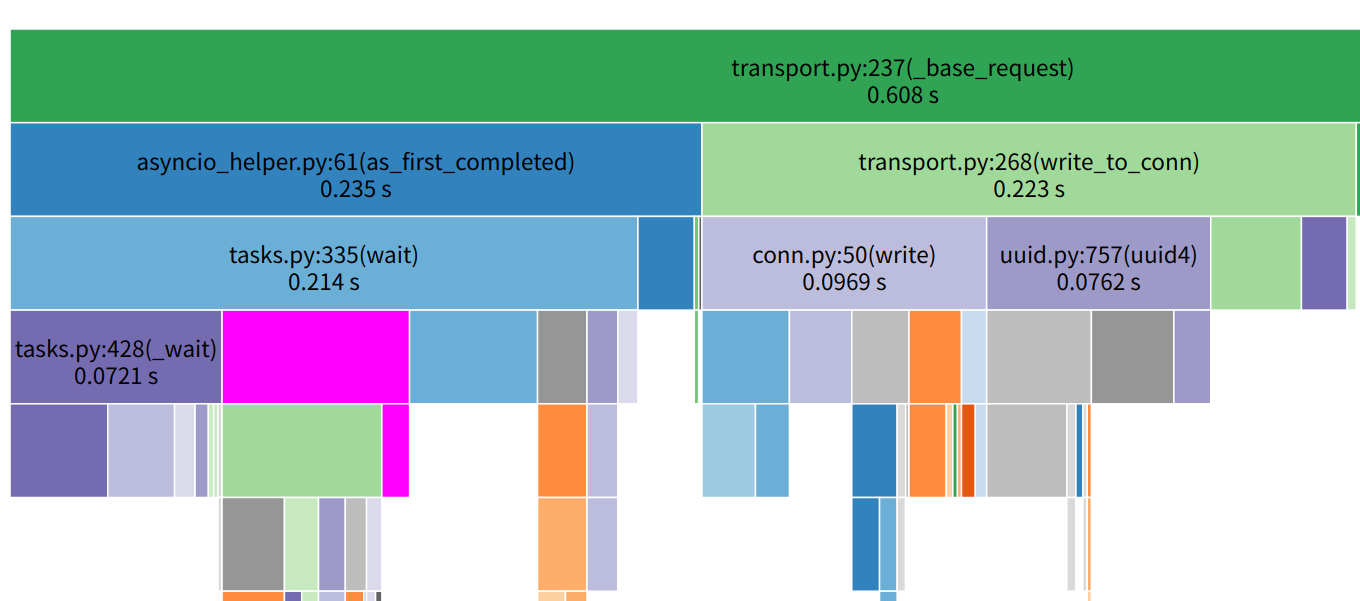
从函数开头开始分析, 首先有个获取correlation_id的函数async_get_snowflake_id, 本来想进行优化的, 后面发现下面的uuid4获取耗时比它还差一点点, 对比后就不想优化了。然后是write_to_conn, 它的主要耗时在序列化, 等待连接drain,打印日志等等, 大部分都是内置函数, 很难再优化下去的, 最后的as_first_completed函数也是一些系统调用,没多少优化机会, 都是应有的流程, 这时我开始怀疑是我排查路径出现问题,于是我就重新对比两个调用过程:rpc调用图 |aiorpc请求调用图 |
从表格的数据和图可以发现我实现的框架无论是发送时长还是接收时长,都会比aiorpc长一些, 在经过梳理后发现这些影响时长的调用大部分都是为了增加一些可用性等功能才添加的, 拆分为一小块一小块的分析时发现问题也不大, 这时我就十分纳闷了, 按道理我单连接复用会比没复用的快很多啊, 怎么跑出来的结果不仅不一样, 还慢很多呢? 于是我重新查看火焰图, 看到aiorpc火焰图client.py:69(call)的时间也就是请求消耗时间为0.394, 而rap同为请求的火焰图块core.py:112(wrapper)显示的时间为1.43s, 他们的差距大概在3倍左右, 与压测跑的qps相差倍数是一样的, 我猜想这个压测代码的主要耗时都是函数调用耗时, 而io耗时占比非常的少。 于是我重新看了压测代码, 这时才发现, server的调用代码是纯cpu计算, 没有io耗时的相关代码, 代码如下:
1
2
3
4
5
6
7
8
9
def run_server () -> None :async def test_sum (a: int , b: int ) -> int:return a + b"example" )
这段代码没有任何io耗时, 本质上框架io相关的代码也不多, 同时是在本地压测, 网络数据没有经过拆解包和路由跳转等, 网络io相关的也不多, 这时client与server的调用就像本地间的函数调用一样, 基本上无须等待网络io, 主要耗时都是在函数的封装调用上, 所以单路复用的优势并没有体现出来。
1
2
3
4
5
6
7
8
9
10
def run_server () -> None :async def test_sum (a: int , b: int ) -> int:await asyncio.sleep(0.01 )return a + b"example" )
然后重新跑代码, 执行结果如下
1
2
3
4
5
6
➜ rap git:(master) ✗ py run python example/benchmark/benchmark_rap.py
这时可以明显的看出来, aiorpc与的rap框架的qps都很低, 在90左右, 而rap的单连接复用版本的qps基本上不变。
3.总结 本次简单学习和运用了性能分析优化, 但是整个框架的主体优化不多, 可能是运行的压测代码覆盖范围不够。 不过倒是学习了一个重要的点, 就是压测的代码要尽量的去模拟真实的环境, 大多数Hello World级别的压测代码很难去反应真实的数据结果, 同时在挑选框架时, 不要只看看文章介绍的性能对比, 也要去了解下压测代码, 看他的实现是否符合真实环境, 压测的结果是否有价值。
NOTE: 在Python的Asyncio生态中, 曾经有一段时间有大量的Asyncio Web框架出现, 他们的压测结果都是十分的美好, 但是都是Hello World级别的压测代码, 所以很多人都不认可这些框架, 当然这些框架也就慢慢的沉没在历史的大海里。
 aiorpc火焰图
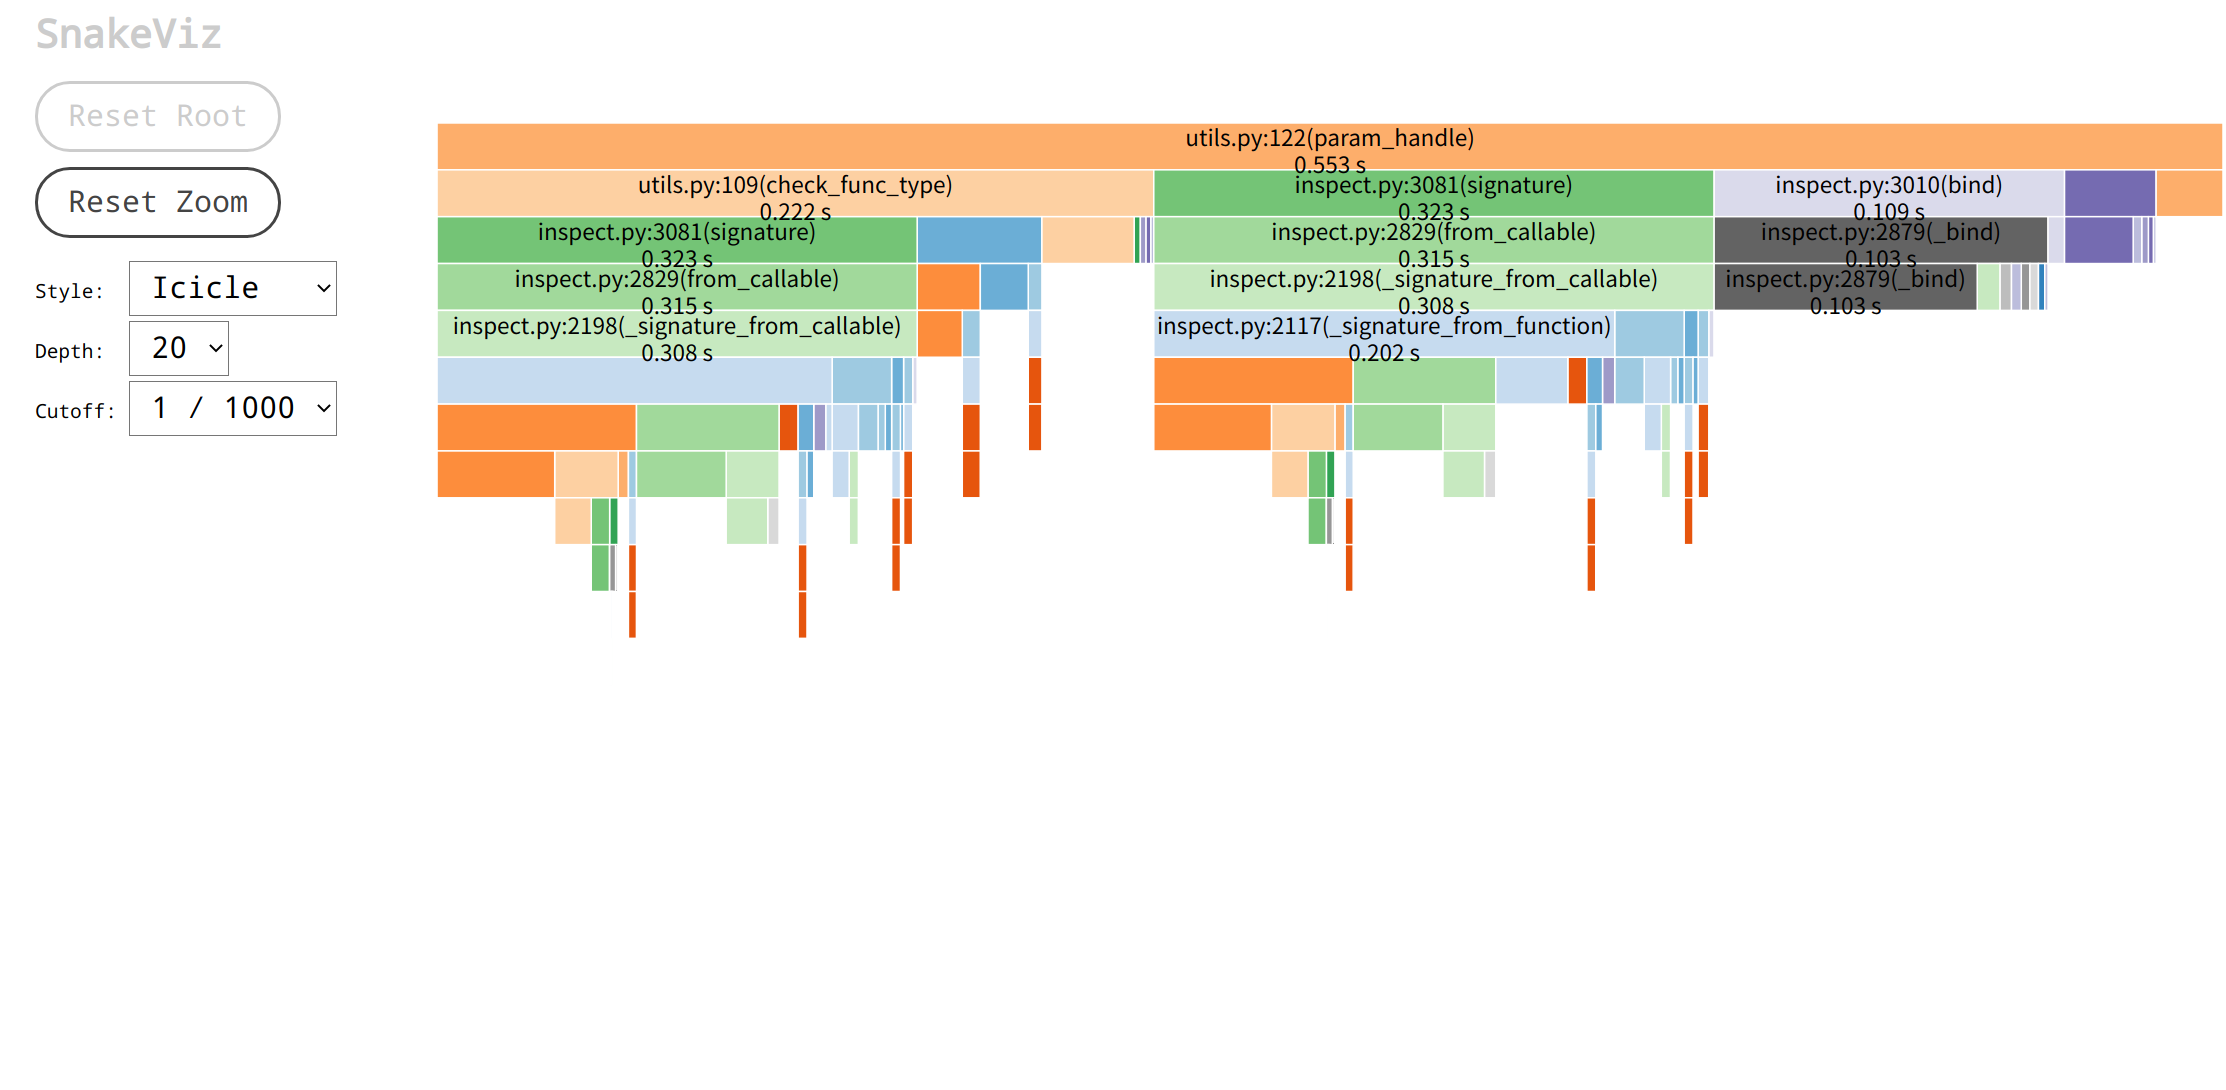 rap param_handle火焰图
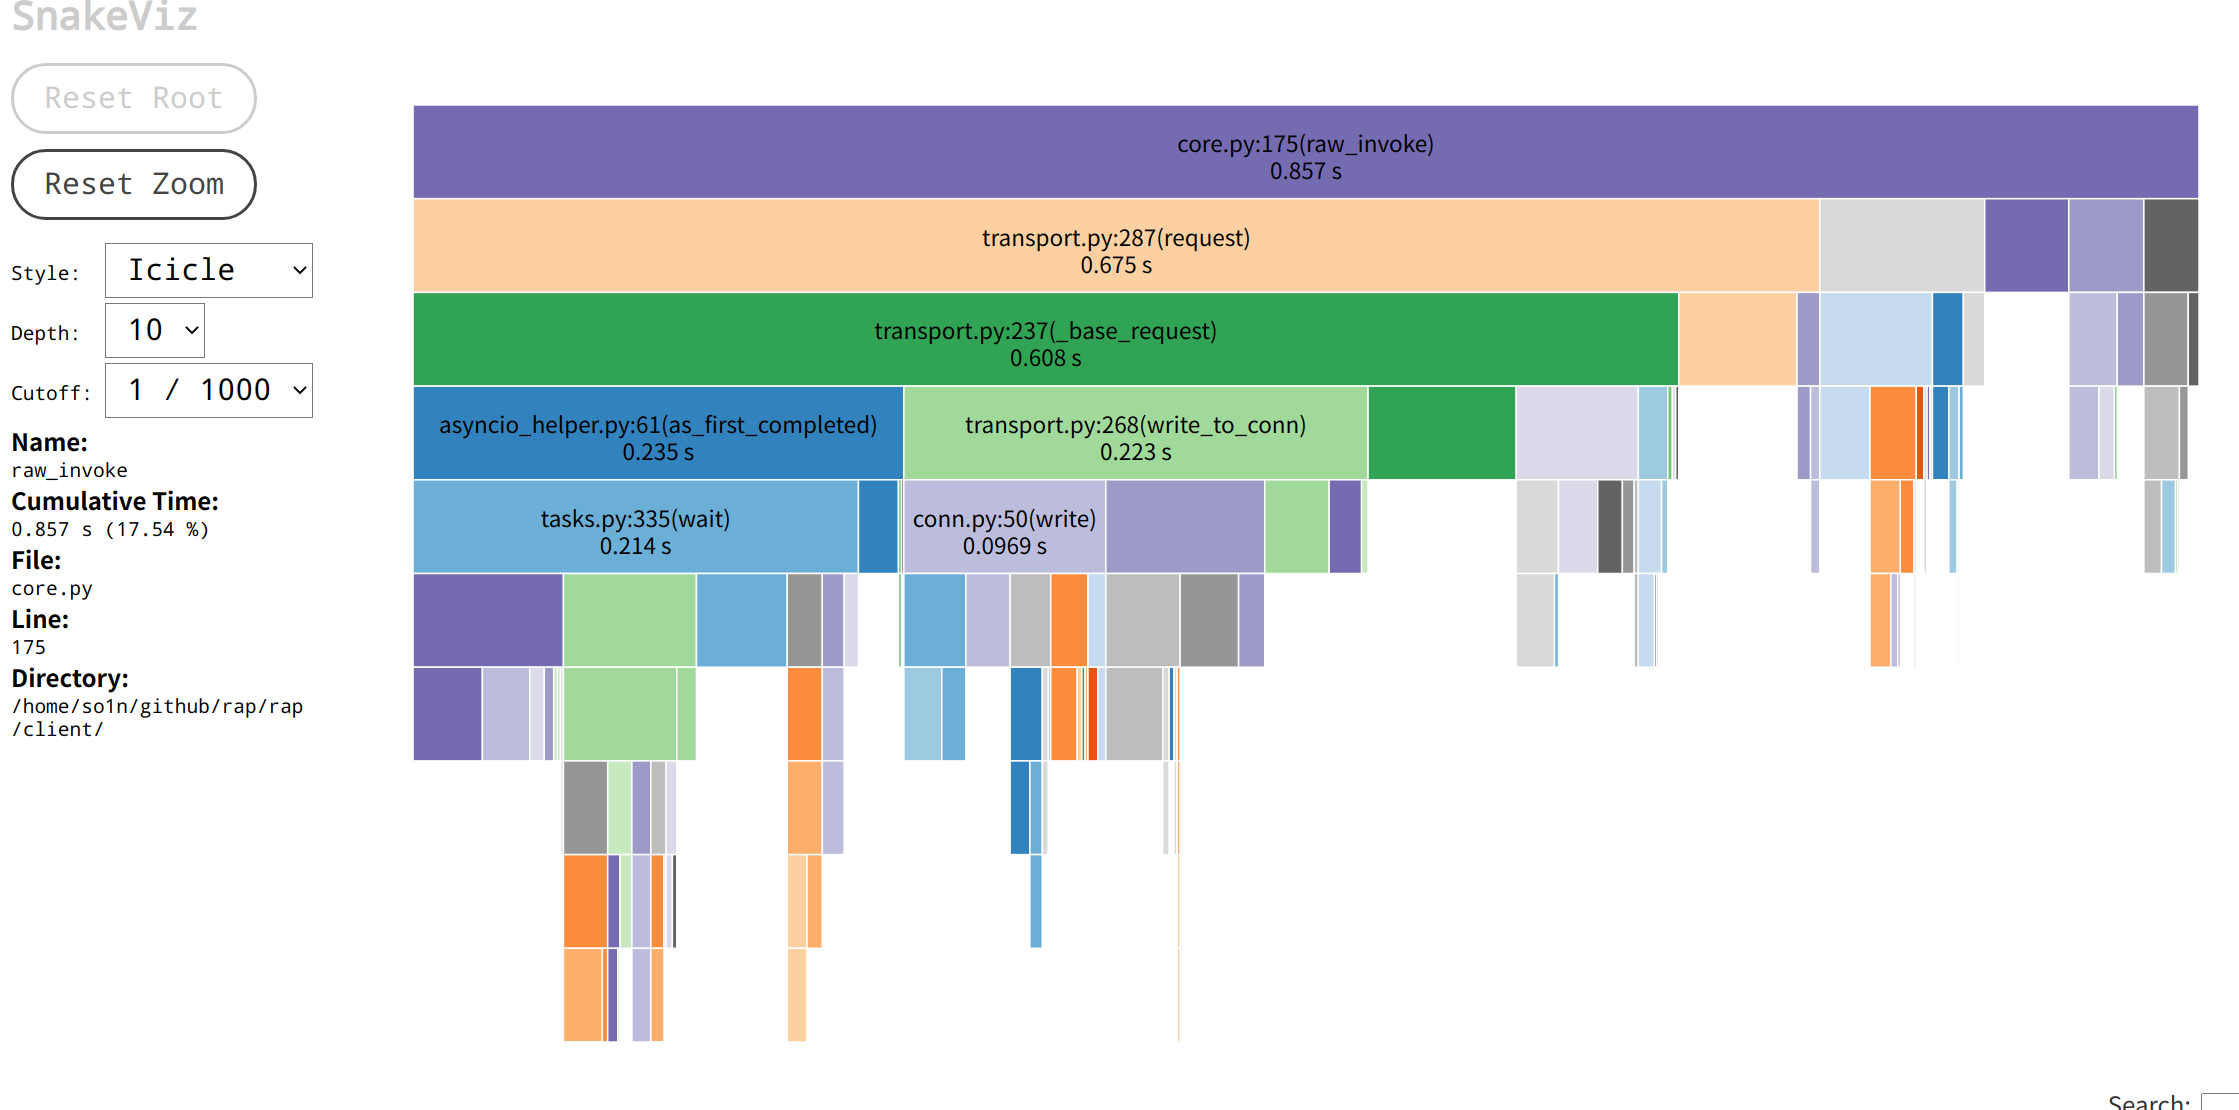
 rpc调用图 |
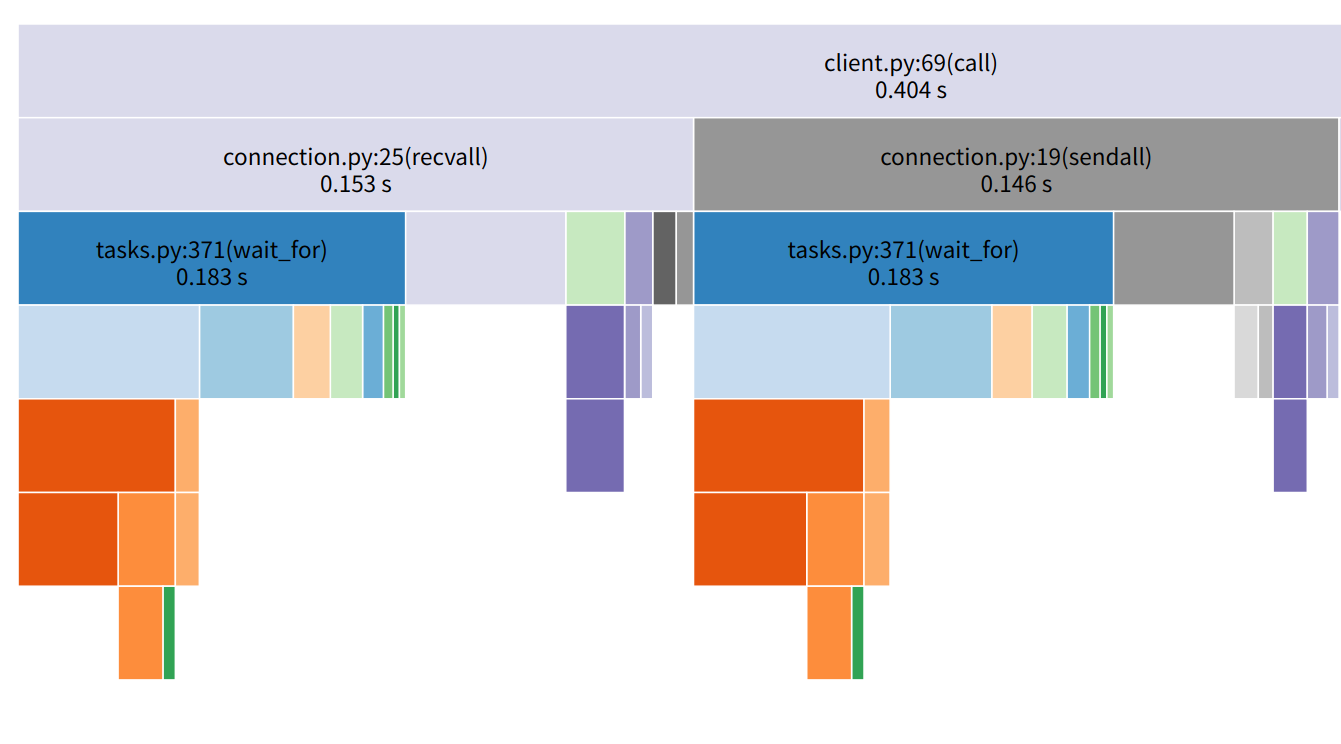 aiorpc请求调用图 |